Performance trends
Review changes in streams, views or other supported activity over time.
Track every stream, every market and every fan from your artist dashboard.
Content, platform, audience and territory performance insight.
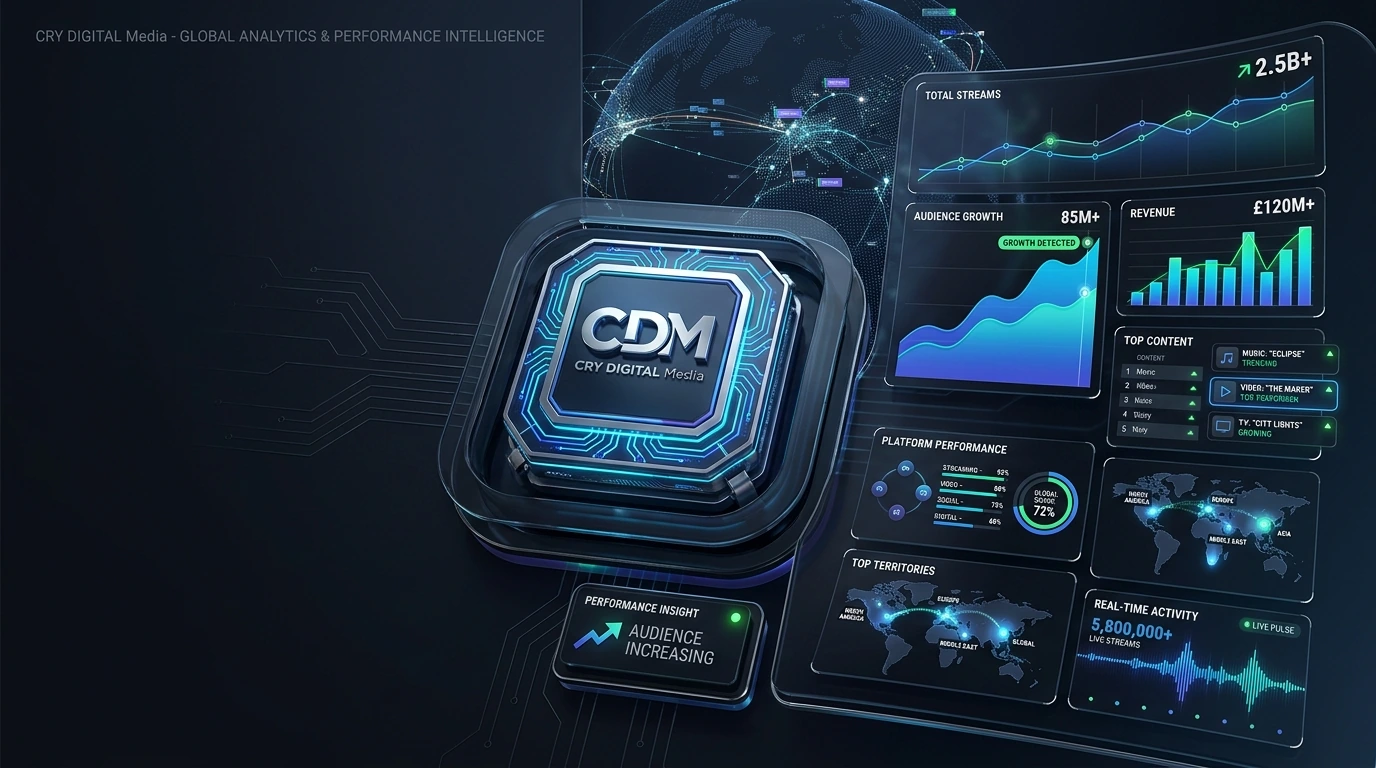 VISUAL 08 MOTION READY
Daily and cumulative streams per release and platform.
Transparent royalty earnings updated as platforms report.
See where your audience is growing, country by country.
Understand listener age, gender and platform preference.
Analytics connects content performance with platforms, territories, audience activity and revenue context. The goal is not to create a wall of charts, but to help teams understand what is happening, where it is happening and which content needs attention.
Review changes in streams, views or other supported activity over time.
Compare titles or releases within the available dataset without inventing public performance claims.
Understand where audience or delivery activity is occurring across supported reporting regions.
Compare activity across available destination or reporting sources in one visual language.
Present relevant audience trends when that data is available to the account.
Connect performance and royalty reporting views without confusing analytics with a guaranteed payout figure.
A useful dashboard makes it easy to move from a high-level overview to a selected content record.
The public visual uses placeholders, while real account views should display only data actually available from the connected reporting sources.
No. Public visuals are illustrative. Authenticated reporting should use the actual data available to the account.
The interface is designed around selectable content, platform and territory context.
Performance and revenue reporting can be connected conceptually, but they are different data workflows and should remain clearly labelled.
Operational delivery status is handled primarily through catalog and tracking views, while analytics focuses on performance after data is available.
Analytics is most useful when it stays connected to the catalog, territory, platform category and reporting period that produced it. The CRY analytics layer focuses on clear trends and comparisons without inventing performance claims or relying on copied third-party dashboard designs.
Compare approved content records across views, streams, engagement or other available performance measures.
Observe growth, retention or geographic patterns using the data actually available to the account.
Connect performance to territories so distribution and marketing teams can understand regional differences.
Compare supported platform categories or verified destinations without implying unavailable data sources.
Read performance in the context of release dates, campaigns, updates and catalog events.
Use rights or match information as an operational layer where the account has eligible rights services.
Connect available royalty or revenue reporting to content and period, without presenting estimated data as guaranteed earnings.
Prepare structured summaries for internal review, partners or account owners while keeping private data scoped correctly.
Explore the service that fits your catalog, submit a business or creator application, or contact the CRY DIGITAL Media team about distribution, CMS, rights, channel management and platform operations.